What a signal physically
A signal is a quantity that changes over time. Sound specifically is variation in air pressure. When something vibrates (a bell, a vocal cord, a guitar string), it pushes air molecules back and forth, creating alternating zones of slightly higher and slightly lower pressure than normal atmospheric pressure. That traveling pattern of compression and rarefaction is a sound wave.
A microphone is a diaphragm that physically moves in response to those pressure changes. That mechanical motion gets converted into a voltage that rises and falls in step with the air pressure. A speaker does the reverse, voltage coms in moving the diaphragm and the air pressure changes making sound. The book calls both devices transducers, meaning something that converts energy from one form into another (mechanical to electrical, or electrical to mechanical).
This matters because it tells you what a signal is not. It is not the sound itself, and it is not “data” in some abstract sense. It’s a physical measurement of something varying over time, and everything downstream (Signal objects, Wave objects, spectrums) is just increasingly convenient mathematical bookkeeping on top of that physical fact.
The book also notes signals don’t have to vary over time. Elevation along a hiking trail is a signal varying over space instead of time. An image is a signal varying over two spatial dimensions. A video is a signal varying over two spatial dimensions plus time. The math in this book generalizes to all of these, but sound (a 1D signal over time) is the simplest case to start with.
Periodic signals, cycles, and frequency
A periodic signal repeats itself after some fixed chunk of time. Hit a bell, and the pressure wave it creates oscillates in a repeating pattern.
- Cycle: one full repetition of the pattern.
- Period: how long one cycle takes, measured in seconds (or milliseconds for fast vibrations, since audio periods are tiny — the bell’s period is about 2.3 ms).
- Frequency: how many cycles happen per second. This is just 1 divided by the period. Its unit is Hertz (Hz), meaning “per second.” Technically a “cycle” isn’t a physical unit like a meter or a kilogram, it’s just a count, so Hz is a bit of an unusual unit: it’s literally 1/seconds.
The relationship is inverse: short period means high frequency (fast vibration, high pitch), long period means low frequency (slow vibration, low pitch).
The bell example comes out to about 439 Hz, close to 440 Hz, which is the internationally standardized tuning pitch orchestras use, called A4 in scientific pitch notation. That notation just numbers octaves: A4 is the A near the middle of a piano, A5 is the next A up (double the frequency), A3 is the next one down (half the frequency).
Another important fact, doubling frequency = going up exactly one octave. That relationship (frequency doubling = octave) is not arbitrary, it’s how human pitch perception works we hear equal frequency ratios as equal-sized musical steps, not equal frequency differences.
What is a octave and i didnt understand the last para
What a sinusoid actually is (the math the book assumes you know)
The book says a tuning fork produces a sinusoid, meaning a signal shaped like the trigonometric sine function. Understanding sine function best video on youtube.
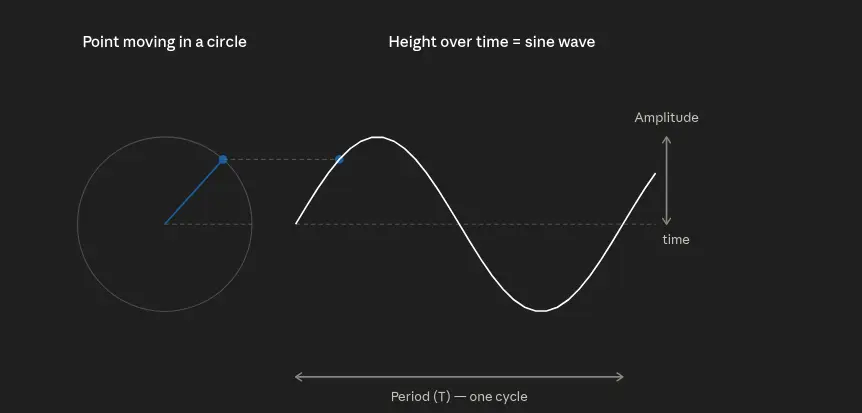
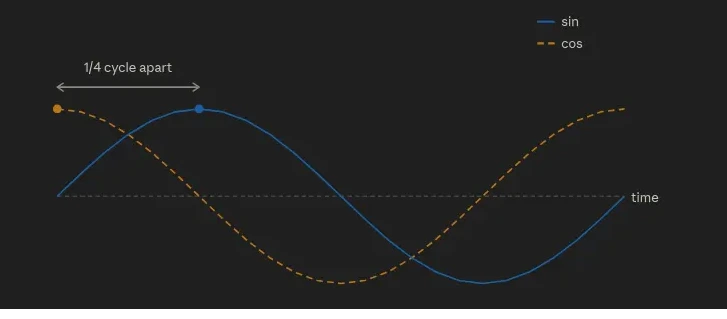
A tuning fork produces a near-perfect sinusoid because its physical motion is simple harmonic motion, a specific kind of vibration where the restoring force pulling something back to center is proportional to how far it’s displaced. This is the simplest possible kind of oscillation, and it happens to trace out exactly a sine wave over time. Most real-world vibrating objects (strings, air columns, drum skins) do not move this simply, which is why their signals aren’t clean sinusoids.
Waveform and timbre
The shape of one period of a periodic signal is called the waveform. A violin produces a periodic signal too, but its waveform per cycle is a complicated, jagged shape rather than a smooth sine curve.
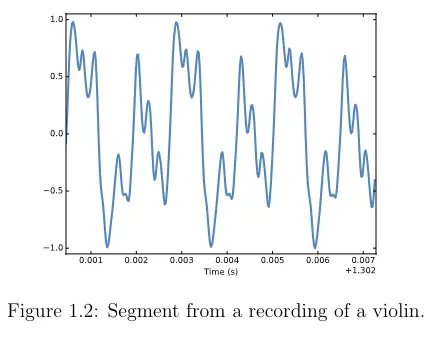
This complexity is what timbre is. Two instruments can play the exact same note (same fundamental frequency, same pitch) and sound completely different, because their waveforms have different shapes.
Cause of harmonica?
Spectral decomposition (core theorum of the book)
Any signal, no matter how complicated or jagged its waveform, can be built by adding together a bunch of simple sine waves of different frequencies and amplitudes.
This is a real mathematical result (Fourier’s theorem, from Joseph Fourier, early 1800s). Sine waves of different frequencies are like a set of building blocks that are independent of each other. You can’t build a sine wave of one frequency by combining sine waves of other frequencies, they don’t interfere with or duplicate each other’s information. Therefore if you have enough of them (in principle infinitely many, in practice a finite useful set), you have enough building blocks to construct literally any repeating shape by choosing the right amplitude for each frequency. 3Blue1Brown video on fourier transform
- DFT (Discrete Fourier Transform): the mathematical operation that takes a signal and tells you exactly which frequencies, and how much of each, are needed to rebuild it.
- FFT (Fast Fourier Transform): not a different concept, just a very fast algorithm for computing the DFT. Without the FFT, computing a DFT directly is computationally expensive; the FFT makes it practical to do in real time on ordinary computers, which is why digital audio processing became feasible at all.
The output of running this analysis is called the spectrum, a plot with frequency on the x-axis and amplitude (strength) of each frequency component on the y-axis. Where the waveform view shows you the signal changing over time, the spectrum shows you the same information reorganized by frequency content instead.
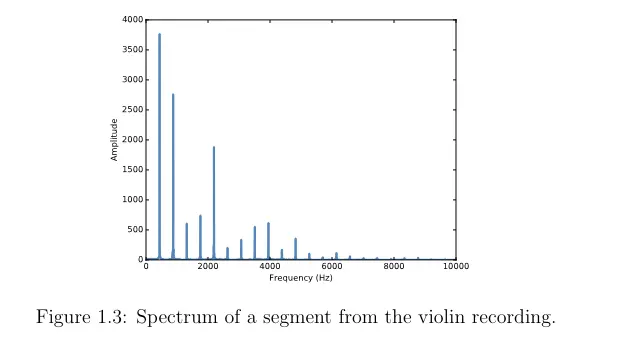 These are called the time domain and frequency domain respectively two different but mathematically equivalent representations of the exact same signal. DSP is largely about moving between these two views depending on which one makes a given task easier.
Fundamental frequency, dominant frequency, and pitch
- Fundamental frequency: the lowest-frequency component present.
- Dominant frequency: whichever component has the largest amplitude (is loudest).
- Often these are the same, but not always.
- Perceived pitch is normally determined by the fundamental, even in the rarer case where it isn’t the loudest component. Human hearing is tuned to pick out the fundamental as “the note,” even if technically some harmonic is more energetic.
Harmonics, and the physics the book doesn’t explain
The other spikes in a real instrument’s spectrum sit at whole-number multiples of the fundamental (in the violin example: 880, 1320, 1760, 2200 Hz, which are 2x, 3x, 4x, and 5x the roughly 440 Hz fundamental). These are called harmonics. The vibrating string (or column of air in a wind instrument) is fixed at both ends. Only certain vibration patterns, called standing waves, can fit stably between two fixed ends: the whole string moving as one big arc, or the string split into two half-arcs moving in opposite directions, or three, and so on. These allowed patterns happen to vibrate at exactly 1x, 2x, 3x, 4x… the fundamental frequency, because that’s the only way the wave pattern fits neatly between fixed endpoints without canceling itself out. So harmonics aren’t a coincidence, they’re a direct physical consequence of vibrating something that’s constrained at its boundaries.
The book connects this to music theory:
- 880 Hz is exactly one octave above 440 Hz (an octave is defined as a doubling of frequency).
- 1320 Hz is roughly a perfect fifth above that, 1760 Hz is two octaves up, 2200 Hz is roughly a major third above that.
- These specific ratios happen to form the notes of an A major chord spread across octaves, which is why harmonically rich sounds tend to feel musically pleasant to us: the overtones of a single note are already outlining a chord.
Equal temperament is mentioned as the reason some of these are only approximate matches to musical notes. Historically, tuning systems tried to make musical intervals match pure small-number frequency ratios exactly (a perfect fifth being exactly 3:2, for example). The problem is you can’t make every interval a clean ratio simultaneously across a full keyboard without some intervals sounding badly out of tune in certain keys. Equal temperament is the compromise adopted in Western music: it divides the octave into 12 equal steps (each note’s frequency is a fixed multiplier of the previous one), so every interval is slightly “off” from a pure ratio, but consistently so in every key, which is why a piano can play in any key without retuning.
Once you have the harmonics and their amplitudes, you can reconstruct the original signal by literally adding those sine waves back together, which is a direct consequence of the spectral decomposition idea above: decomposition and reconstruction are two directions of the same operation.
Continuous signals vs discrete samples
(Signal, Wave, and sampling theory basics)
A Signal object represents a mathematical function, defined for every possible instant in time, from negative infinity to infinity. This is continuous, in the sense that between any two time values, there are infinitely many more time values, and the signal has a defined value at every one of them. You cannot store this in a computer directly, since a computer cannot hold infinitely many values.
To actually do anything with it, you evaluate it: you pick a finite list of specific time points and compute the signal’s value at just those points. This finite list of (time, value) pairs is what a Wave object is. Each individual point is called a frame or a sample. This is called sampleing The rate at which you pick these points is the framerate (or sample rate), measured in samples per second. 11,025 Hz is used in the example, which is a real, standard audio rate (a fraction of the common 44,100 Hz CD-quality rate).
Because a Wave only captures the signal at discrete instants, not continuously, there is a hidden assumption that sampling often enough recreates the original signal well. There’s a real theorem behind this (Nyquist-Shannon sampling theorem), which roughly says you must sample at more than twice the highest frequency present in the signal to be able to reconstruct it accurately. This youtube video and this explains it well. Sample too slowly relative to a signal’s frequency content, and you get an artifact called aliasing, where a high frequency masquerades as a false lower one.
The book saves the full explanation for chapter 2, but the reason framerate matters at all, and why 11,025 or 44,100 Hz are chosen rather than arbitrary numbers, traces back to this theorem.
The timestep (time between consecutive samples) is just 1/framerate. At 11,025 Hz, that’s about 91 microseconds between samples, meaning the computer is recording an air-pressure snapshot roughly 11,000 times per second.
Colab notebooks for this chapter
Why segment exists
At 440 Hz over half a second, you get 220 full cycles crammed into the plot, which visually just looks like a solid smear of color, not a readable waveform. The segment method solves this by copying out just a small time window (a few periods) so you can actually see the shape. This isn’t a new concept, it’s a practical necessity created directly by how densely packed real audio cycles are in time. #needtofindthisinbookandunderstand
Spectrum object and filtering
Once you have a Wave, make_spectrum runs the FFT to get a Spectrum. From there, three operations are introduced:
- low_pass: reduces (attenuates) frequency components above some cutoff.
- high_pass: reduces components below some cutoff.
- band_stop: reduces components between two cutoffs.
The physics intuition
High frequencies correspond to fast, sharp changes in a sound (brightness, crispness, sibilance, cymbal-like textures). Low frequencies correspond to slow, rumbling, bass-like content. Removing the highs (low-pass) is why the result sounds muffled or dark, you’re removing exactly the content responsible for perceived brightness, while the underlying pitch (fundamental, usually a lower frequency) survives untouched.
Filtering, converting back to a Wave, and playing it demonstrates the full round trip the earlier diagram describes, Signal to Wave to Spectrum, and back to Wave again, with an edit made while in the frequency domain along the way. This "edit in the frequency domain, then convert back" pattern is one of the central workflows in all of digital signal processing.
WAV files, briefly
read_wave and write deal with WAV files, a standard uncompressed audio file format that essentially stores exactly what a Wave object holds, a long list of sample values plus a framerate, with a small header describing the format. This is why reading/writing WAV maps so directly onto the Wave class, a WAV file is basically a Wave object saved to disk.